
Your best Product Expert
Sitting beside every user
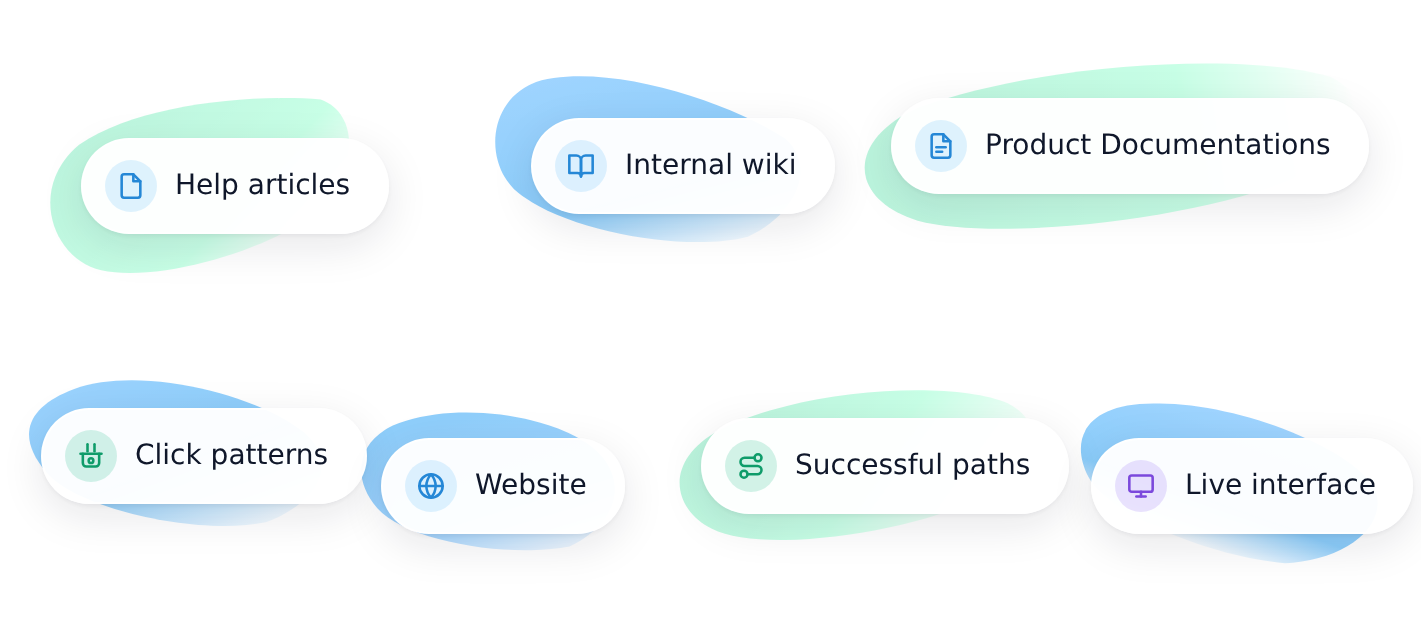
Knows your product before your users do.
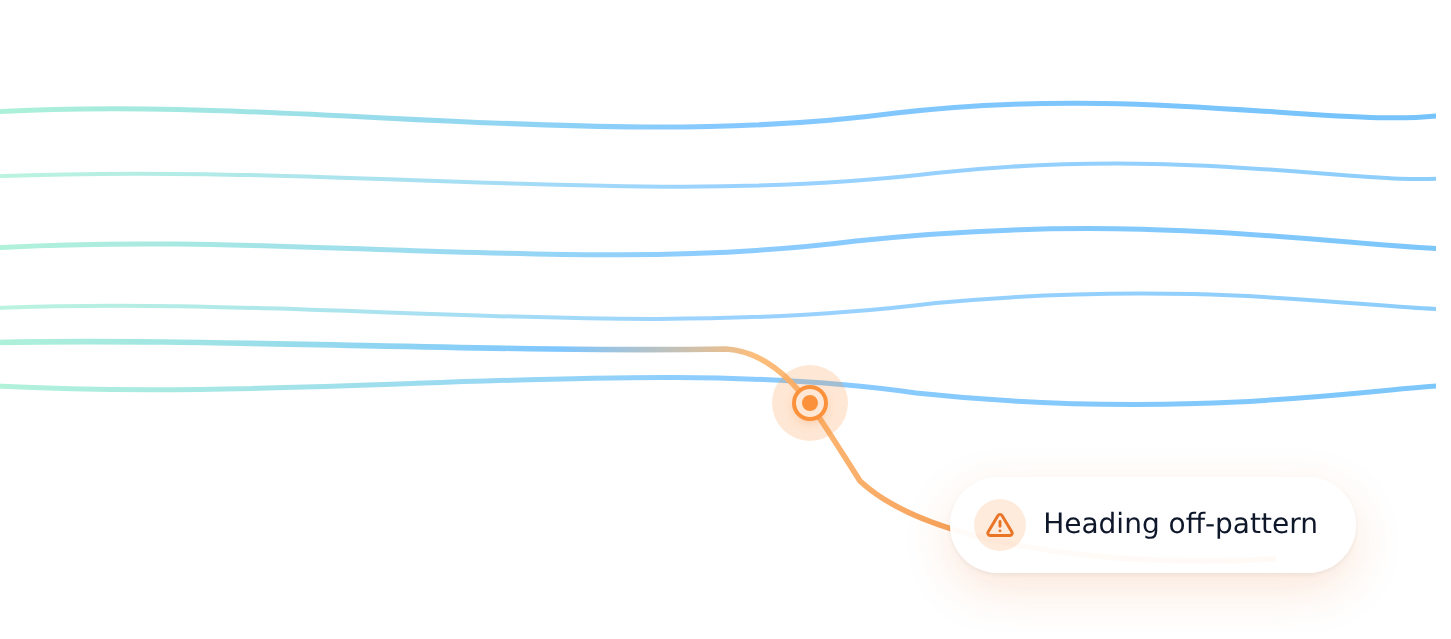
Spots when a user is about to get stuck.
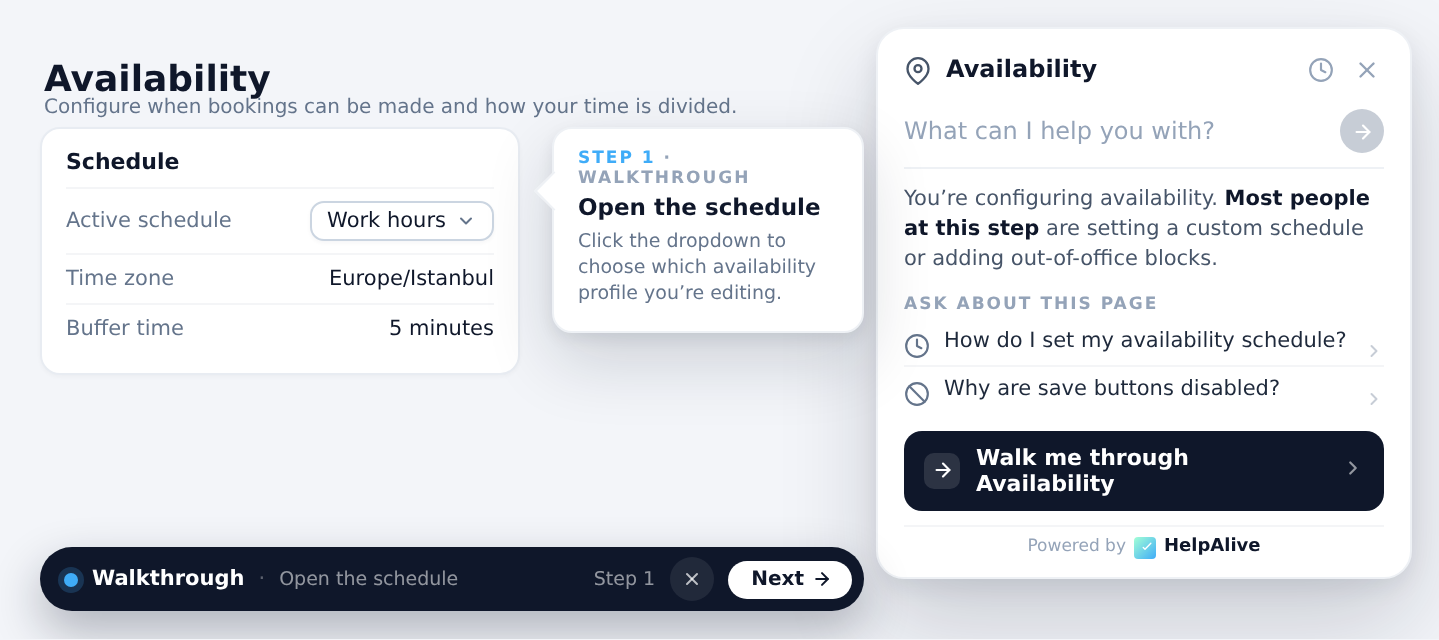
Walks them through it. Or just does it.
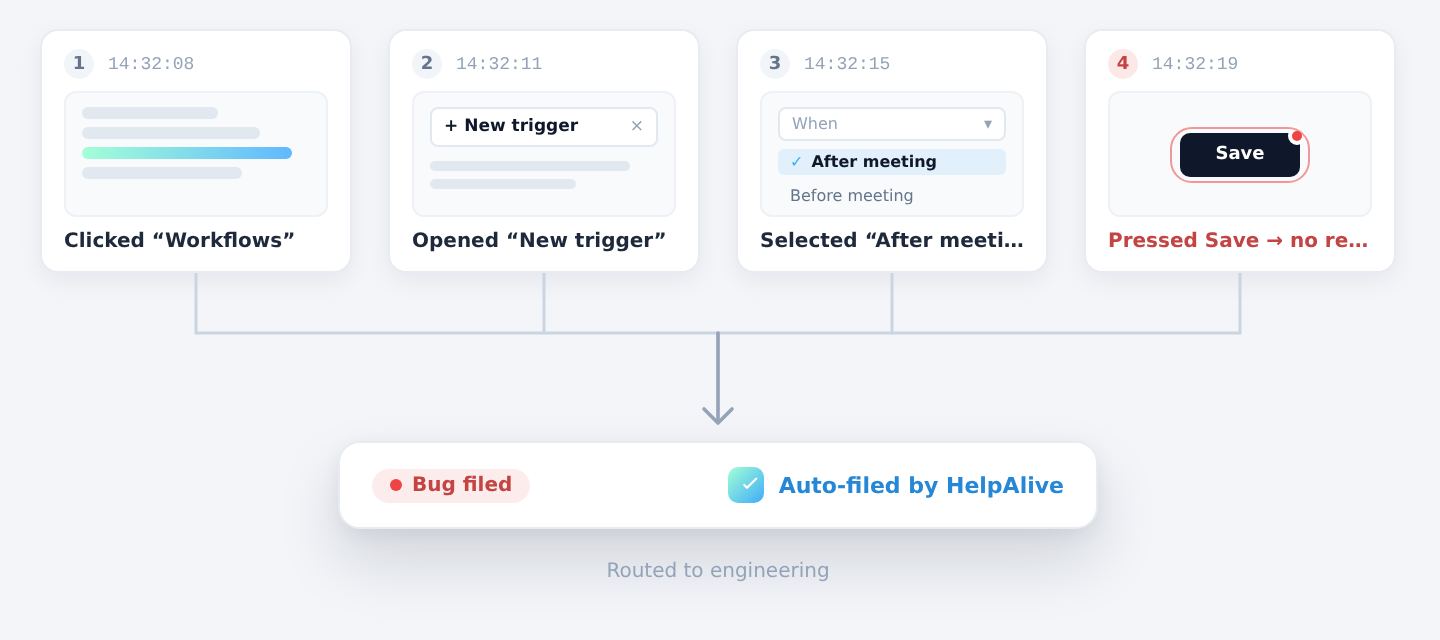
Files the rare real bug. Never punts to a human queue.
Your Users Are Struggling — And Nobody's Watching
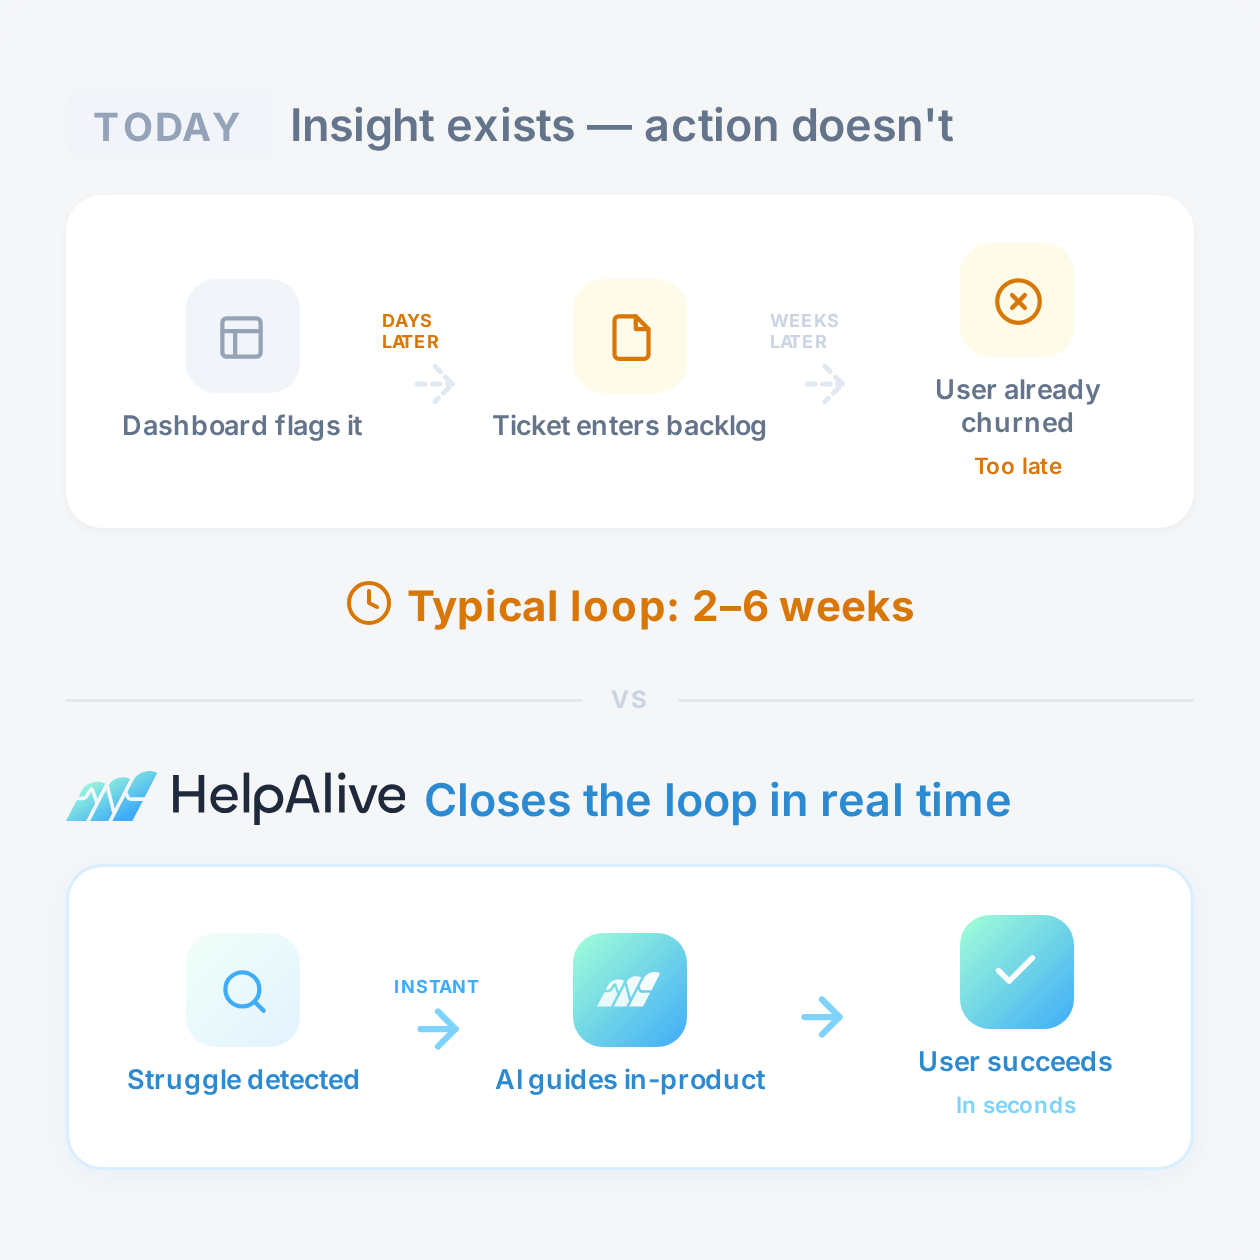
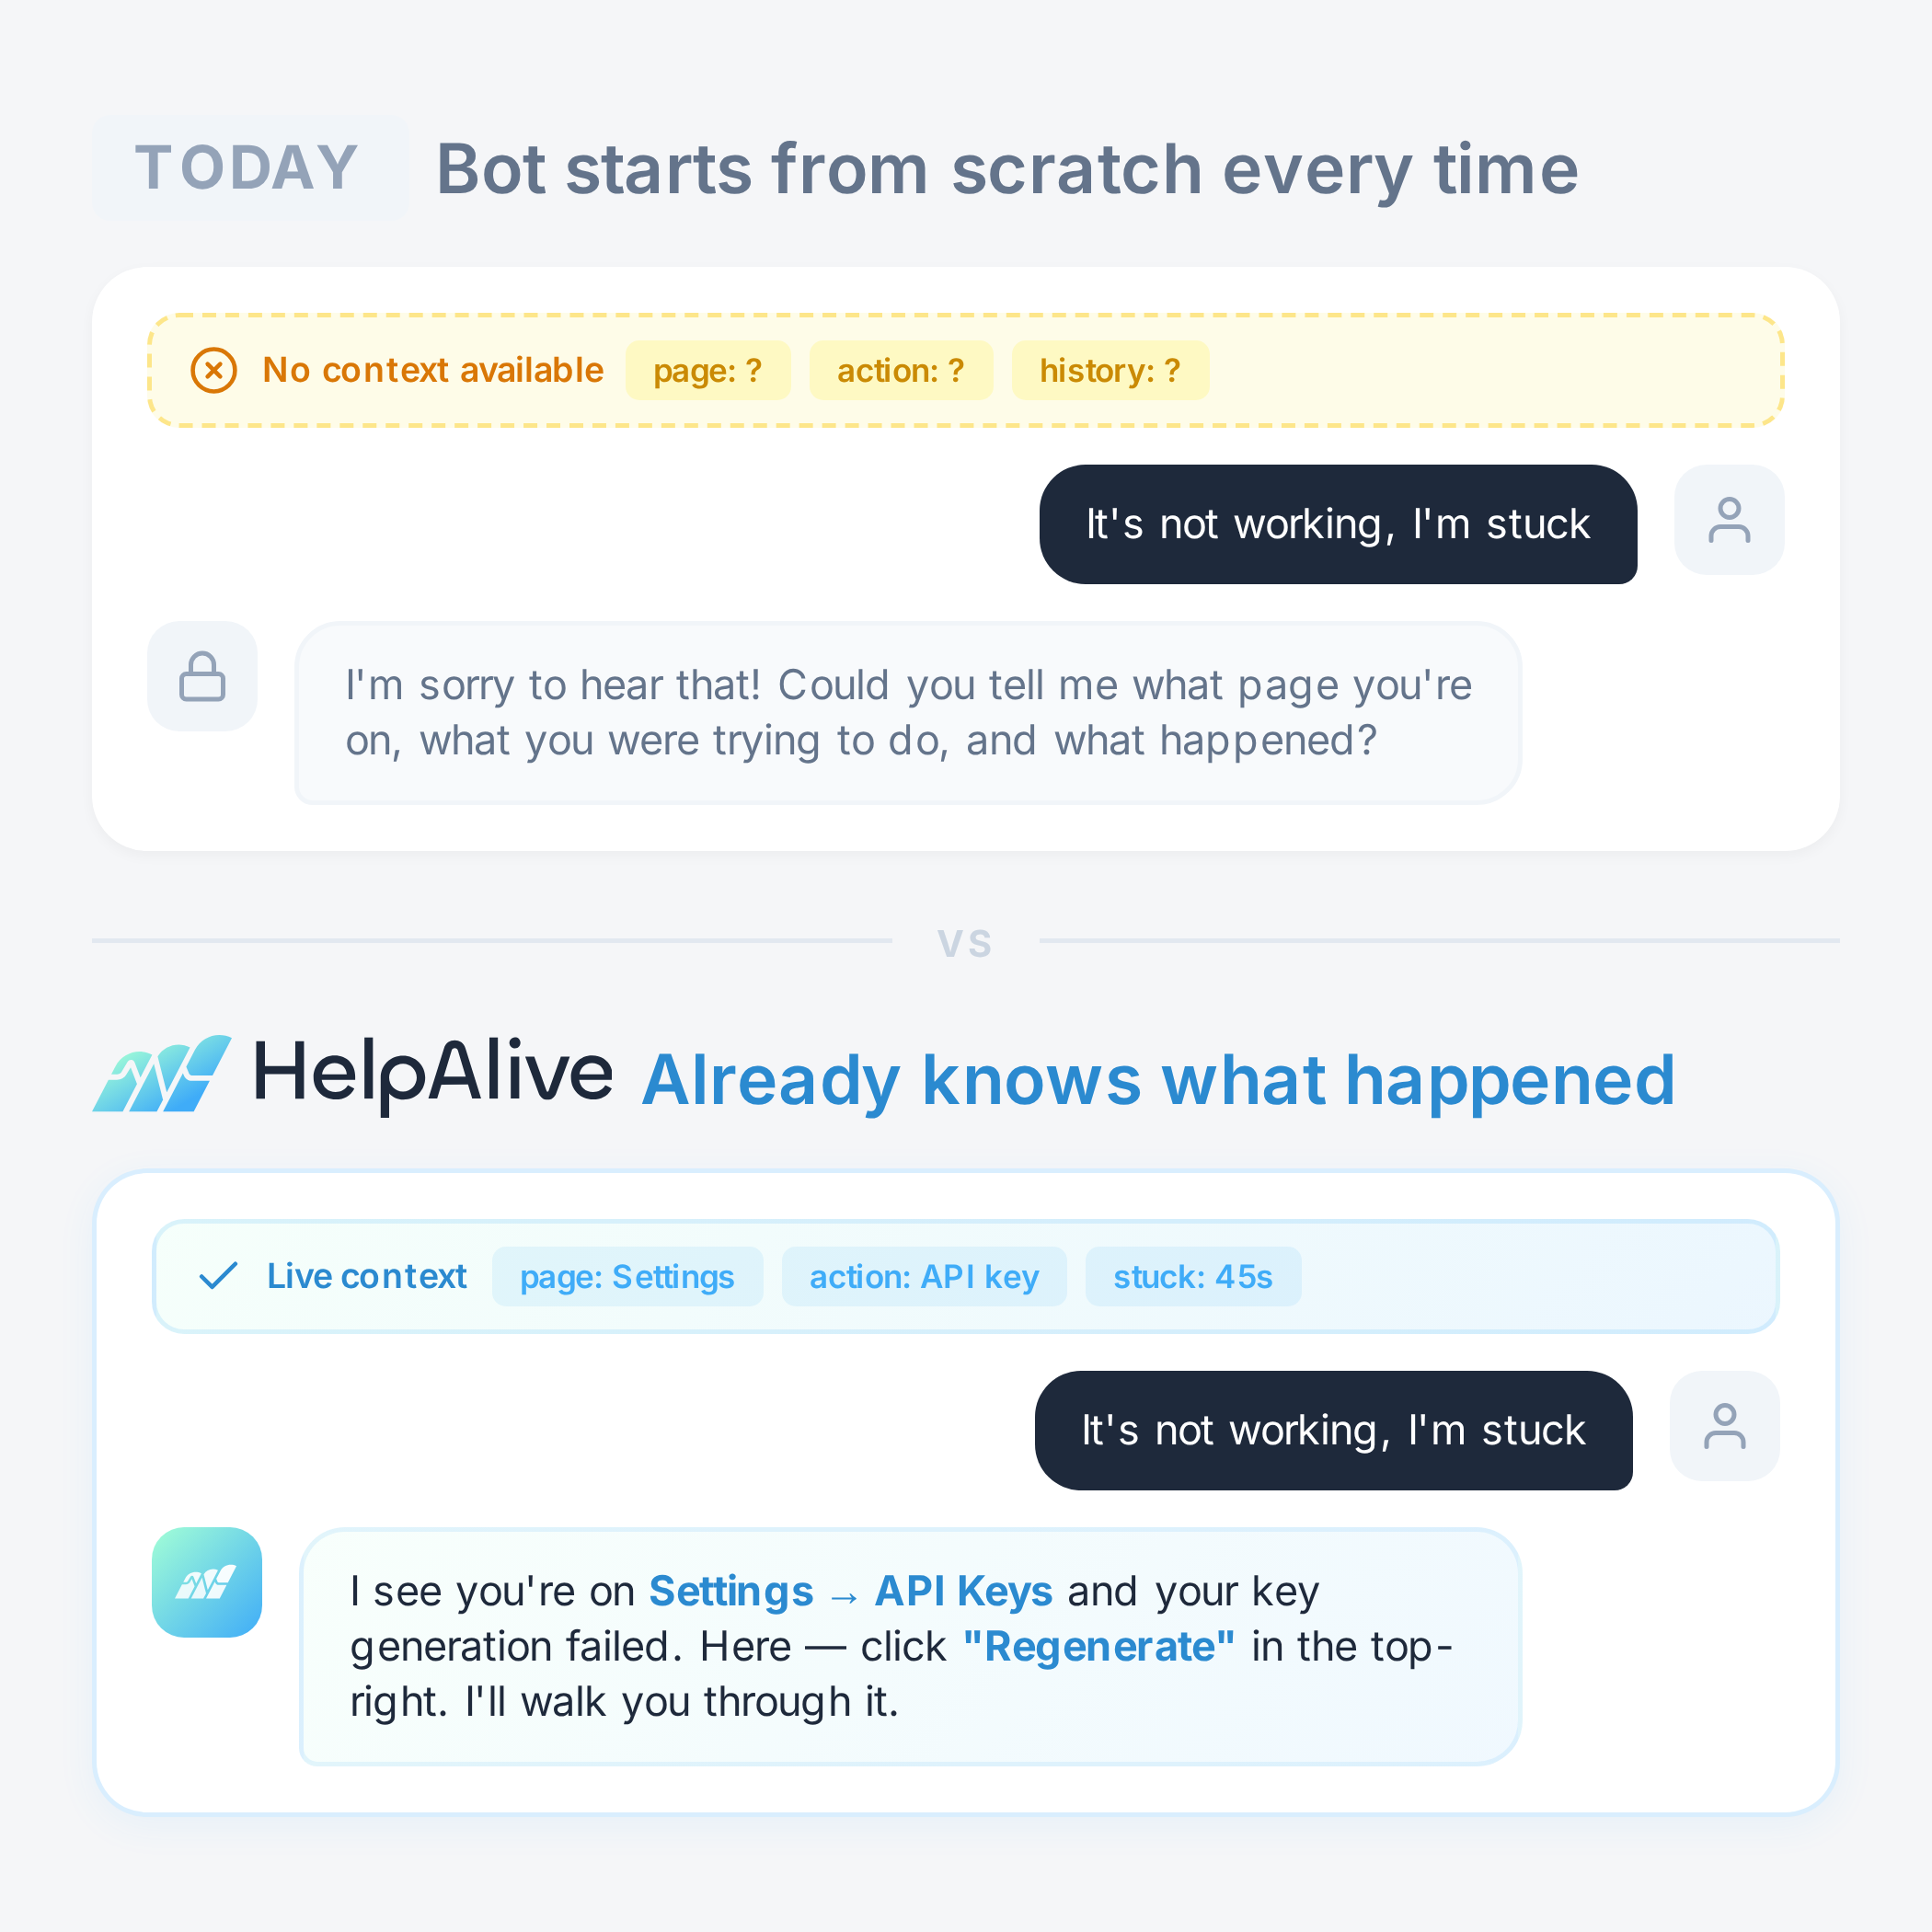
It already knows. Whether you ask or it notices first.
.png)

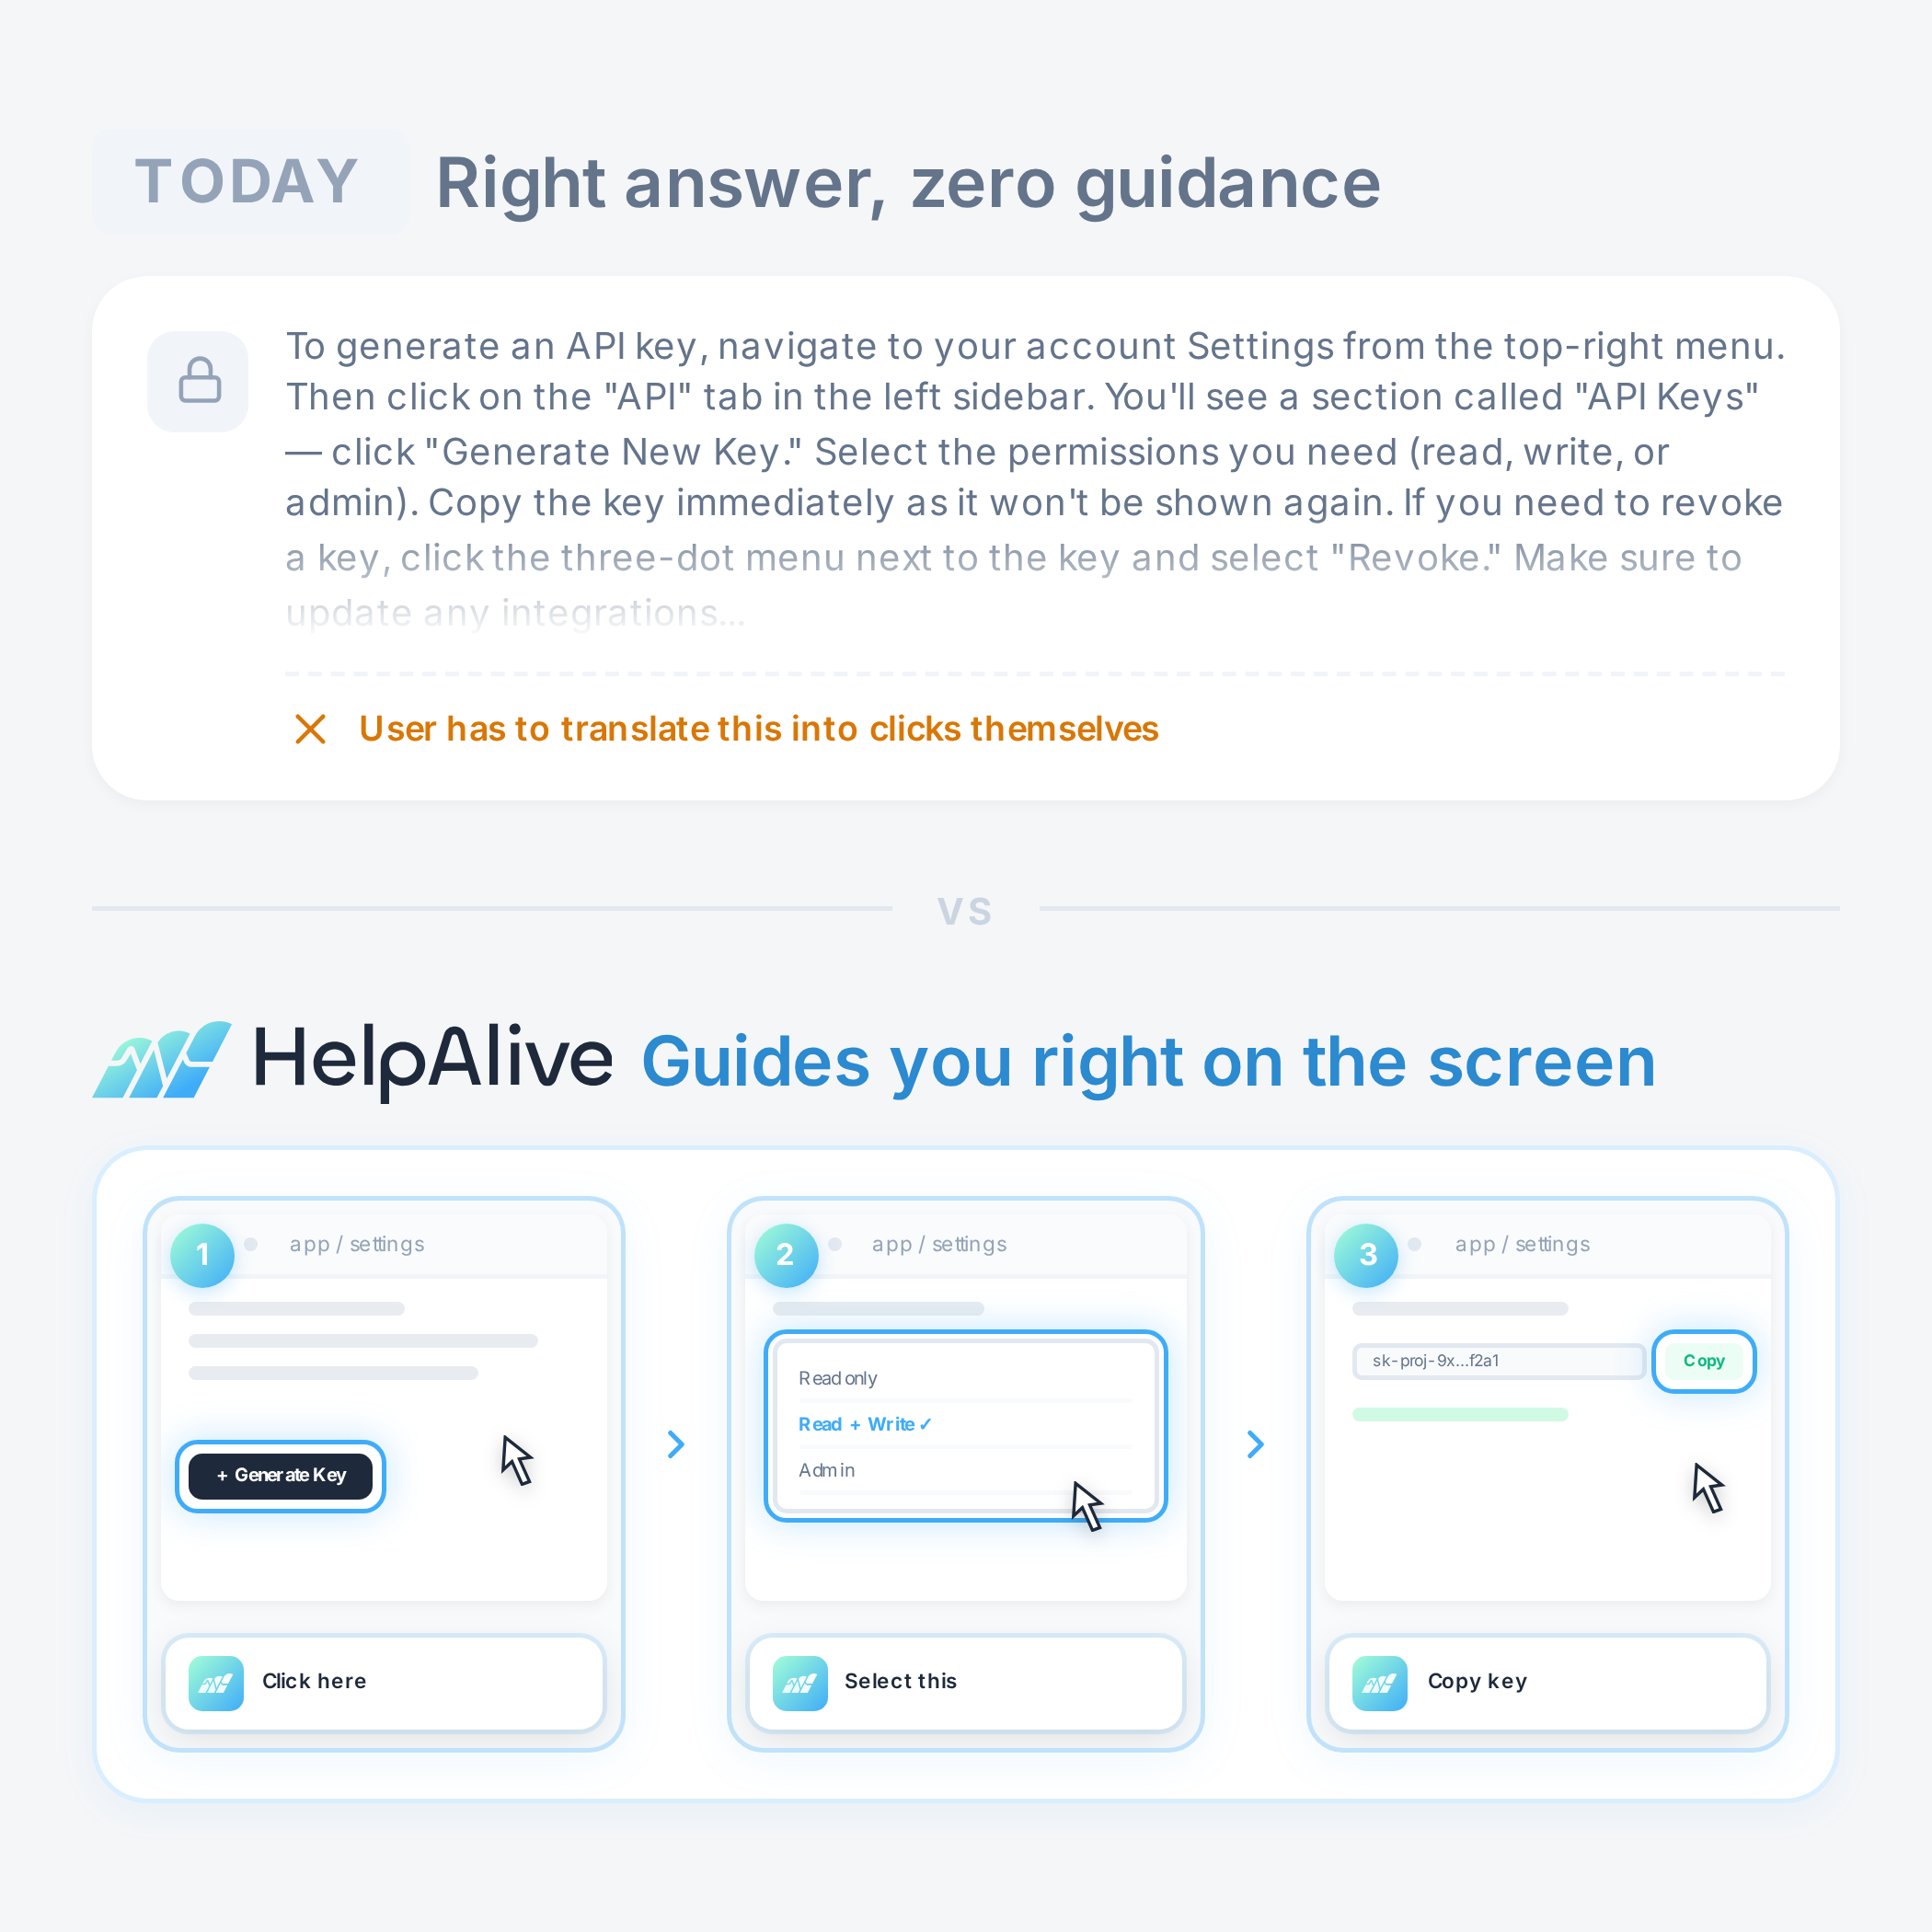
Walkthroughs that write themselves.
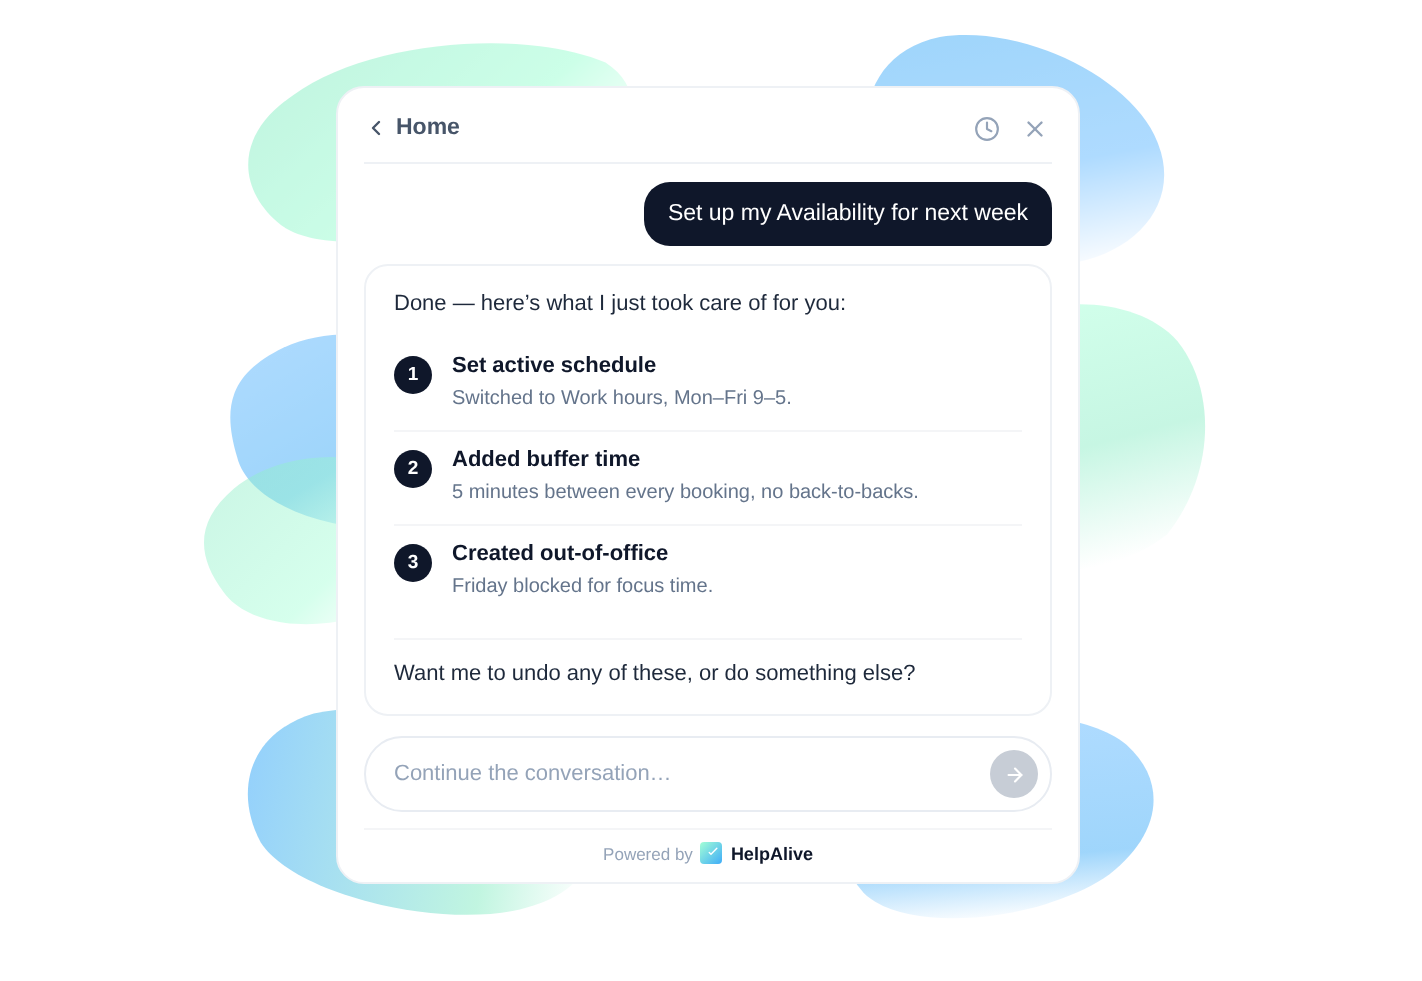
Doesn’t just explain. Does.
.png)
One tap to report.
Scenario already there.
Drop in one script. You're live.
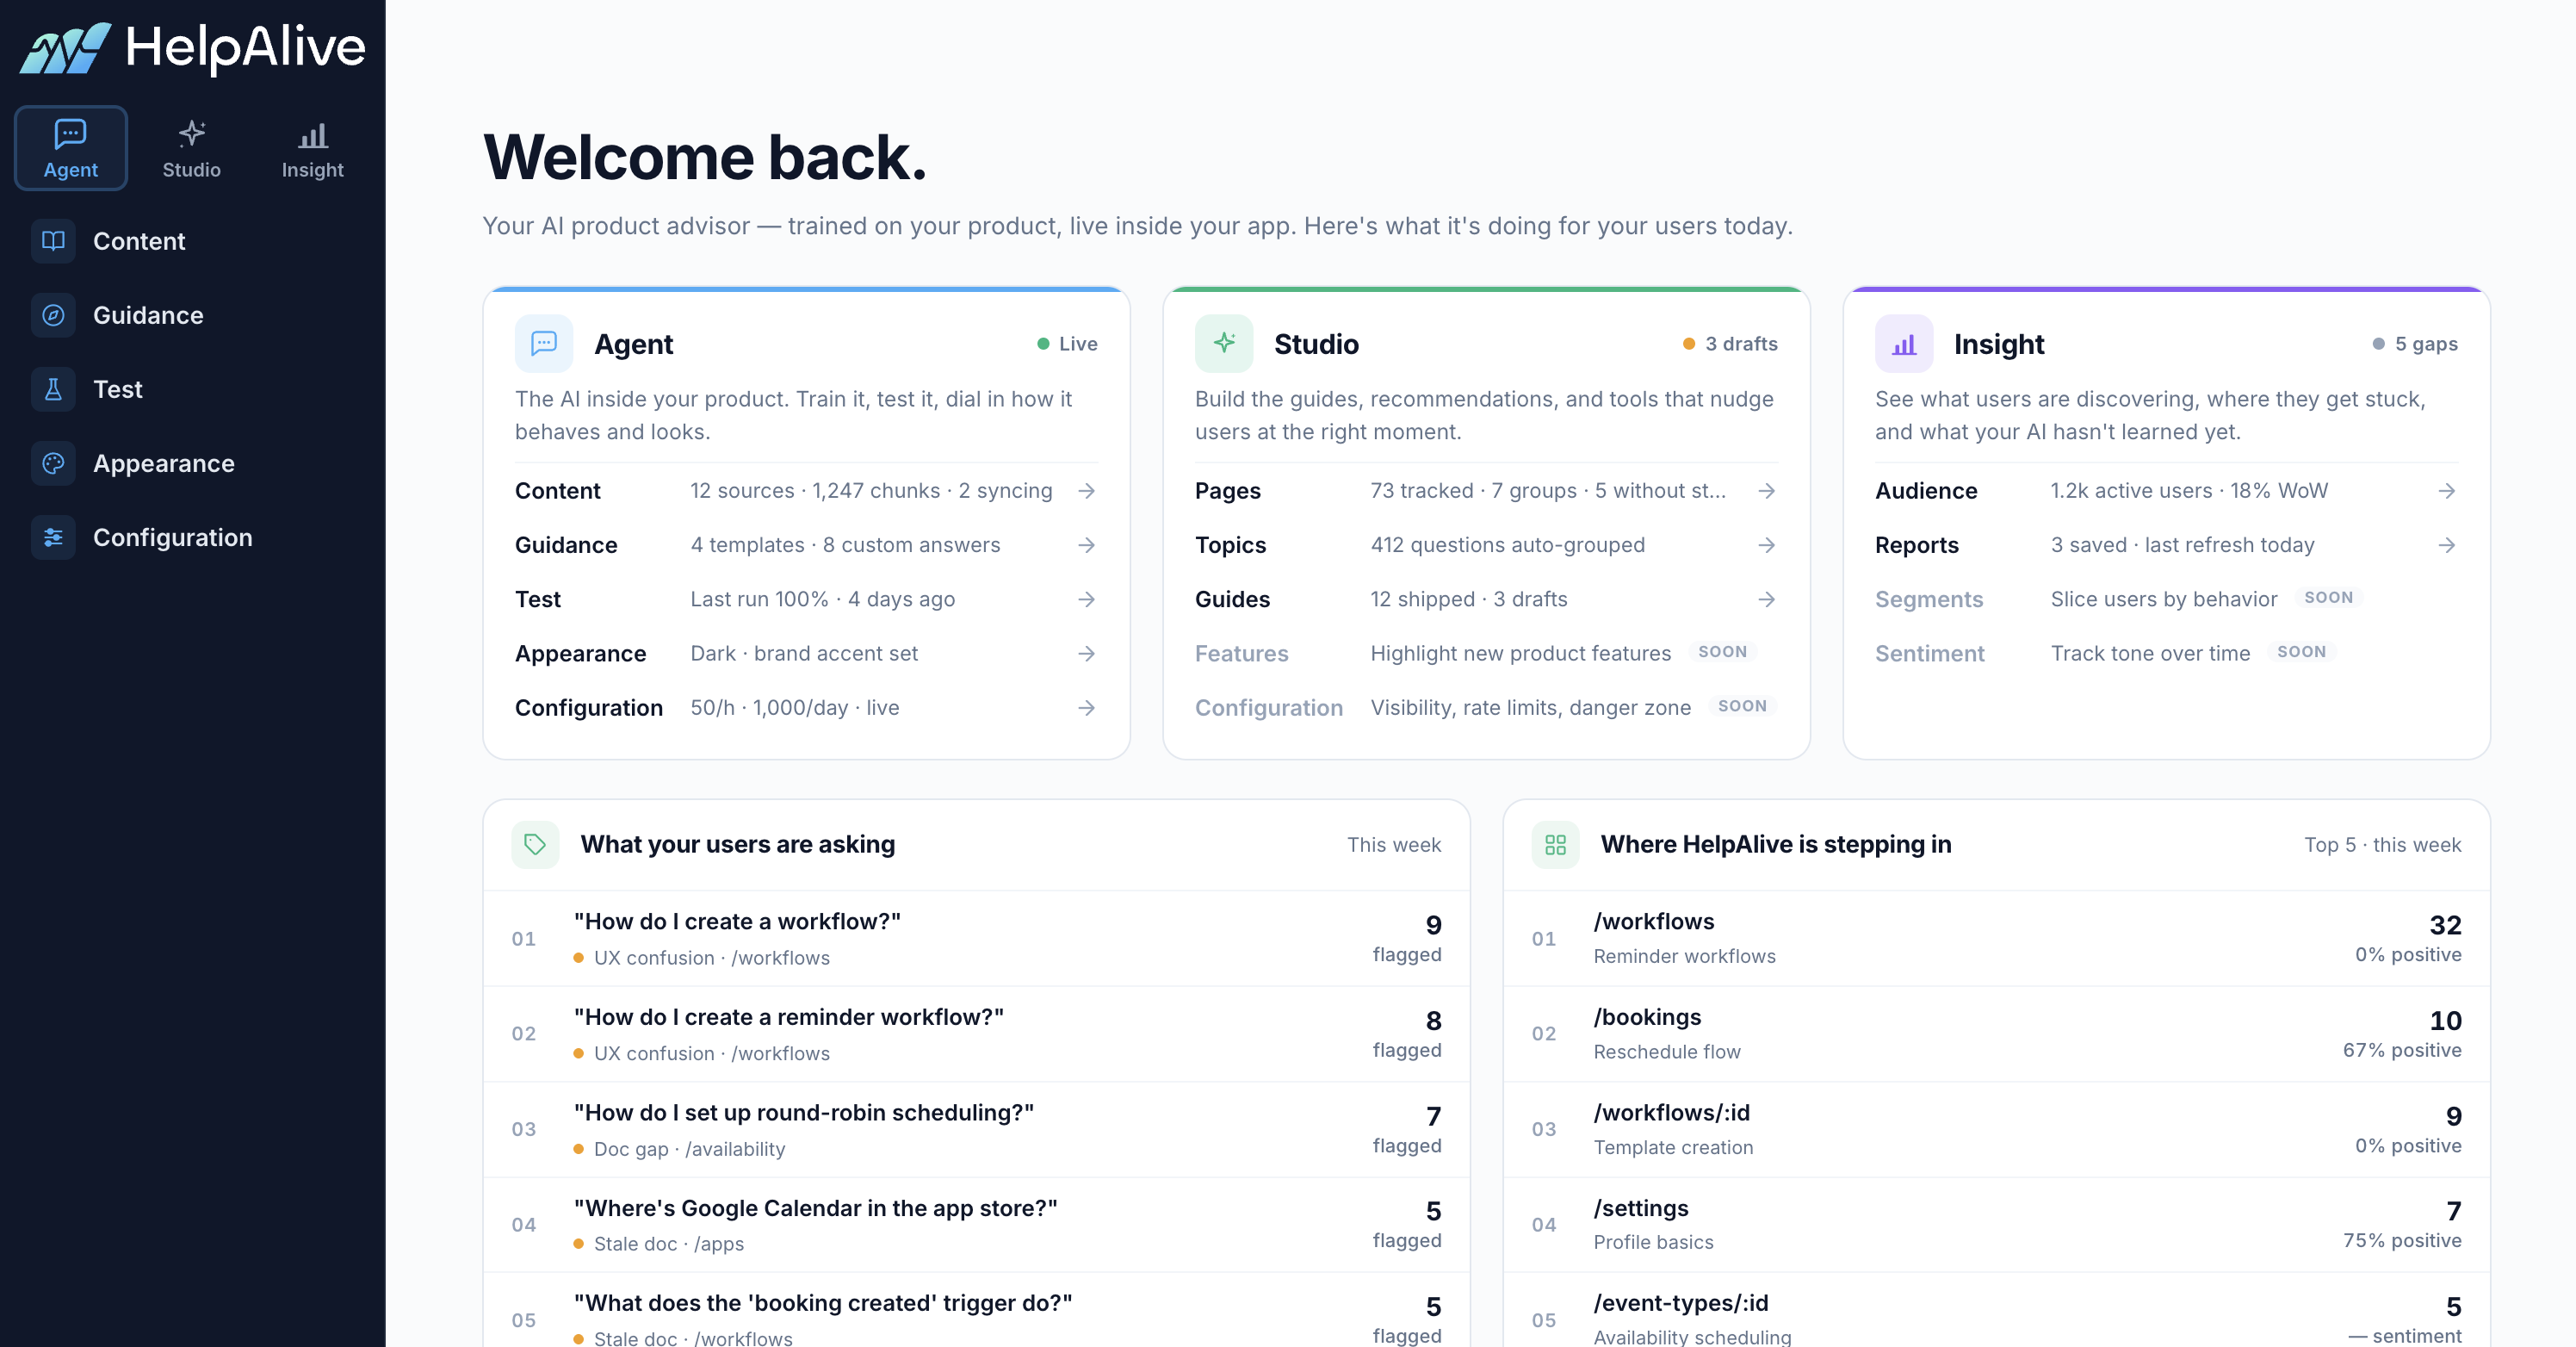
Our platform brings everything into one streamlined workspace
All You Need to Know
Not today, but that's where we're heading. HelpAlive works alongside tools like Intercom or Zendesk, catching problems before they become tickets. But the end goal is clear: AI will make human-led support disappear. We believe HelpAlive is one of the strongest offerings on that path, starting with the moments where users get stuck and need help right now, not hours later.
It learns from crowd behavior. When hundreds of users navigate the same feature, HelpAlive builds a picture of what the successful path looks like and spots when someone is going off track. No manual rules, no tagging. It gets smarter with every session.
We never capture what users type, and every event flows through Microsoft Presidio — the same open-source PII engine trusted by enterprise teams — to automatically detect and redact emails, phone numbers, tokens, credit cards, and other sensitive data. Consent-mode ready for GDPR and CCPA out of the box.
HelpAlive runs as a lightweight JavaScript snippet, so it works with React, Vue, Angular, server-rendered pages, or anything that runs in a browser. Your tech stack doesn't matter — if your users access it through a web browser, HelpAlive works.
HelpAlive only appears when there's a real signal that someone is stuck — it doesn't pop up on a timer or interrupt flows that are going well. There are built-in frequency controls so the same user won't see repeated interventions, and you can configure exactly when, where, and how often guidance appears. Users can also ask for help on their own terms. The goal is a helpful colleague, not a chatbot ambush.